雅思写作小作文范文 雅思写作混合图 温度与降水

本站小编 免费考研网/2018-10-27

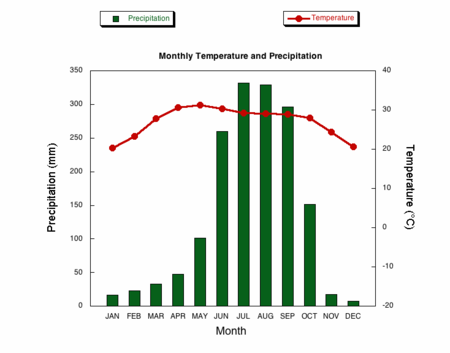
该图表为柱状图和折线图的组合。其中柱状图展示了某个城市一月到十二月的降水量,折线图展示了在此期间温度的变化。两者的趋势并不完全一致。老烤鸭小编搜集了一篇相应的范文,大家参考下考官是如何选取数据并进行比较的。

雅思写作小作文题目

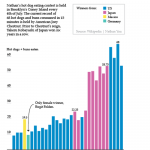
The climograph below shows average monthly temperatures and rainfall in the city of Kolkata.

Summarise the information by selecting and reporting the main features, and make comparisons where relevant.

雅思写作小作文范文

The chart compares average figures for temperature and precipitation over the course of a calendar year in Kolkata.

该图表比较了加尔各答一年中气温和降雨量的平均数据。

It is noticeable that monthly figures for precipitation in Kolkata vary considerably, whereas monthly temperatures remain relatively stable. Rainfall is highest from July to August, while temperatures are highest in April and May.

很明显,加尔各答每个月降水量的数据差别很大。而每个月的温度则保持相对稳定。从7月到8月,降雨量最高,而四月和五月的温度则最高。

Between the months of January and May, average temperatures in Kolkata rise from their lowest point at around 20°C to a peak of just over 30°C. Average rainfall in the city also rises over the same period, from approximately 20mm of rain in January to 100mm in May.

在一月和五月期间,加尔各答的平均温度从最低的20度左右,上升到顶峰的刚刚超过30度。城市中的平均降水量在同样的时期也在上升,从一月份的大约20毫米,上涨到五月份的平均100毫米。

While temperatures stay roughly the same for the next four months, the amount of rainfall more than doubles between May and June. Figures for precipitation remain above 250mm from June to September, peaking at around 330mm in July. The final three months of the year see a dramatic fall in precipitation, to a low of about 10mm in December, and a steady drop in temperatures back to the January average. (173 words, band 9)

虽然在接下来的四个月里,温度保持大体一致,但是降水量却在5月和6月间翻了不止一倍。从7月到9月,降水量的数据保持在250毫米以上,并于7月份达到顶峰的330毫米。降水量在一年的最后三个月大幅下跌,在12月到达大约10毫米的低点。 与此同时,气温也稳定降回到一月份的平均水平(共173个单词)。


相关话题/

  • 领限时大额优惠券,享本站正版考研考试资料!
    大额优惠券
    优惠券领取后72小时内有效,10万种最新考研考试考证类电子打印资料任你选。涵盖全国500余所院校考研专业课、200多种职业资格考试、1100多种经典教材,产品类型包含电子书、题库、全套资料以及视频,无论您是考研复习、考证刷题,还是考前冲刺等,不同类型的产品可满足您学习上的不同需求。 ...
    本站小编 Free壹佰分学习网 2022-09-19
  • 雅思写作小作文范文 雅思写作流程图flow chart 蜜蜂生命周期
    雅思写作小作文范文 雅思写作流程图flow chart 蜜蜂生命周期
    该图片展示了蜜蜂从产卵到逐渐成熟的六个阶段。每个阶段都标明了大概的时间,并且用不同的大小来表示蜜蜂的生长程度。在图片的正中间还说明了整个生命周期持续的时间。老烤鸭小编搜集了一篇相应的考官范文,以供大家参考。雅思写作小作文题目雅思写作小作文范文The diagram illustrates the various stages in the life of ...
    本站小编 免费考研网 2018-10-27
  • 雅思写作小作文范文 雅思写作柱状图bar chart 奖牌数量
    雅思写作小作文范文 雅思写作柱状图bar chart 奖牌数量
    该图表展示了12个不同的国家在奥林匹克运动会上获得的奖牌的数量,并用三种不同的颜色来标示金银铜牌。很明显可以看出美国获得的奖牌数量远超其他国家,而苏联则排名第二。雅思写作小作文题目The chart below shows the total number of Olympic medals won by twelve different countries.Summarise the information by se ...
    本站小编 免费考研网 2018-10-27
  • 雅思写作小作文范文 雅思写作表格题table 手机的不同用途
    雅思写作小作文范文 雅思写作表格题table 手机的不同用途
    该表格给出的手机的用途有打电话、照相、收发短信、玩游戏、上网搜索、播放音乐以及记录视频等。展示了它们在2006,2008,2010年三年间使用的比例。老烤鸭小编搜集了一篇相关的考官范文,以供大家参考。雅思写作小作文题目雅思写作小作文范文The table compares the percentages of people using different functions of th ...
    本站小编 免费考研网 2018-10-27
  • 雅思写作小作文范文 雅思写作折线图(线状图)交通方式
    雅思写作小作文范文 雅思写作折线图(线状图)交通方式
    该图表展示了从1970年到2030年期间,英国使用三种交通方式(驾车、公交和火车)上下班的人数的变化。除了以往的数据选取之外,这道题目还有一个很有意思的点在于它涉及到从过去到未来的发展变化。我们可以参考下考官是如何正确使用相关的时态的。雅思写作小作文题目The graph below shows the average number of UK commute ...
    本站小编 免费考研网 2018-10-27
  • 雅思写作小作文范文 雅思写作地图题map 地区变化
    雅思写作小作文范文 雅思写作地图题map 地区变化
    这次我们看到的地图是某个地区从1868年到1994年的变化。跟以前的地图不同的是,它的变化只在一张图上用不同的颜色和标识显示出来。老烤鸭小编搜集了一篇相关的考官范文,以供大家参考。雅思写作小作文题目雅思写作小作文范文The map shows the growth of a village called Chorleywood between 1868 and 1994.这张地图显示了 ...
    本站小编 免费考研网 2018-10-27
  • 雅思写作小作文范文 雅思写作流程图flow chart 纸张回收
    雅思写作小作文范文 雅思写作流程图flow chart 纸张回收
    该图表展示了纸张如何从废纸变为新纸的过程,分为6个阶段。分别为:从各处收集废纸;手工分类;运输;清洁;消除油墨;机器造纸等。老烤鸭小编搜集了一篇相关的考官范文,大家可以参考下如何描述这一过程。雅思写作小作文题目The chart below shows the process of waste paper recycling.Summarise the information by sel ...
    本站小编 免费考研网 2018-10-27
  • 雅思写作小作文范文 雅思写作柱状图bar chart 游戏销售量
    雅思写作小作文范文 雅思写作柱状图bar chart 游戏销售量
    这次图表的内容为四种游戏平台从2000年到2006年这7年间的销量。图中用不同的颜色来表示不同的游戏类型,共有28个数据。因为数据较多,相当考验大家分类对比的能力。老烤鸭小编搜集了一篇相应的考官范文,以供大家参考。雅思写作小作文题目The bar graph shows the global sales (in billions of dollars) of different type ...
    本站小编 免费考研网 2018-10-27
  • 雅思写作小作文范文 雅思写作柱状图bar chart 大胃王比赛
    雅思写作小作文范文 雅思写作柱状图bar chart 大胃王比赛
    小作文范文的文章来研究下柱状图bar chart。这次的图表很有意思,是某地举办的吃热狗大赛。选手要在15分钟内尽可能的吃热狗,数量多者获胜。图表统计了从1980年到2010年获胜者的信息,包括其记录和国籍。老烤鸭小编搜集了一篇相关的考官范文,以供大家参考。雅思写作小作文题目雅思写作小作文范文The bar chart shows the ...
    本站小编 免费考研网 2018-10-27
  • 雅思写作小作文范文 雅思写作折线图(线状图) 美国肉类消耗量
    雅思写作小作文范文 雅思写作折线图(线状图) 美国肉类消耗量
    小作文范文的文章来研究下折线图(线状图)。该图表来自于华盛顿邮报的网站,数据相对于真正的雅思考试而言要更多一些。因此如何挑选数据和进行对比就显得尤为重要。老烤鸭小编搜集了一篇考官写的范文,以供大家参考。雅思写作小作文题目 雅思写作小作文范文The line graph shows changes in the per capita consumption of ...
    本站小编 免费考研网 2018-10-27
  • 雅思写作小作文范文 雅思写作流程图flow chart 太阳能发电
    雅思写作小作文范文 雅思写作流程图flow chart 太阳能发电
    雅思写作小作文题目The diagram below shows how solar panels can be used to provide electricity for domestic use.Summarise the information by selecting and reporting the main features, and make comparisons where relevant.雅思写作小作文范文The picture illustrates the process of producing electricity in ...
    本站小编 免费考研网 2018-10-27
  • 雅思写作小作文范文 雅思写作表格题table 骑行上班人数
    雅思写作小作文范文 雅思写作表格题table 骑行上班人数
    雅思写作小作文题目The table below shows changes in the numbers of residents cycling to work in different areas of the UK between 2001 and 2011.Summarise the information by selecting and reporting the main features, and make comparisons where relevant.雅思写作小作文范文The table compares the numbers ...
    本站小编 免费考研网 2018-10-27
  • 名师经验谈:小作文题型的写作技巧
    柱状图:“比较”(找出similarity)和“对比”(找出difference),是写作的关键,既要横向总结所有柱状图表的共性特征,也要分别 ...
    考研 Freekaoyan.com 2008-04-06
  • 雅思小作文专项填空练习
      1)At Ford, the nation's No. 2 automaker, overall vehicle sales____(下降) 2.4 percent from a year earlier to 2 ...
    考研 Freekaoyan.com 2008-04-06
  • 雅思考试时应该先写小作文还是先写大作文
    考生在雅思写作考试时有两种常见写作顺序。一种是先写大作文,另一种是先写小作文。到底哪一种更为可取呢?如果先写大作文的话, ...
    考研 Freekaoyan.com 2008-04-06
  • IELTS考试范文精选集(包含小作文)
    范文1Nowhere in the world has the issue of tobacco been so much debated as in our society. Nowadays, tobacco is more har ...
    考研 Freekaoyan.com 2008-04-06